This series of blog posts is intended to provide general knowledge to stay safe and comply with the CMS Emergency Preparedness E-Tags that took effect in November of 2017. These new E-Tags are now being surveyed for compliance in addition to the already federally regulated F-Tags and CMS’s requirements related to codes and standards, known as K-Tags.
We have previously tackled general takeaways and tips for community-based and tabletop exercises. It is up to you to consult with a qualified legal expert to determine what is best for your situation.
The SNF survey results discussed here are from 1/1/18 to 6/20/18 and are publicly available on the CMS Health Inspection Database found on Nursing Home Compare at Medicare.gov.1
About the Expert
Ray Miller is Direct Supply’s Director of Risk Management & Safety and has over 30 years’ experience in occupational safety. Well-known in the industry and across the country, Ray has been a longstanding traveling educator and has presented to hundreds of Senior Living communities.
Takeaways from the First Six Months of Surveys
There are many ways to slice and dice the first half of the 2018 data. The trick is in learning as much as we can to help us to better inform and enable us to both protect our residents and to prepare for that next survey. Naturally, some of the lessons will depend upon which state or states in which you operate. With that said, here are some of the high-level observations so far:
- 26 cited tags in 43 states
- 4,584 separate citations
- The top 14 states were issued 3,745 E-Tags, which is 82% of the total tags
– California had 892 citations (or 19% of the total) - The bottom 11 states totaled 42 two citations
What can we take away from these results? First of all, once surveyors are more experienced with these regulations, regardless of your state, there is plenty that they can and probably will be examining, asking for and about, and, of course, citing you for. They may also interview staff, residents and family members.
A second, and perhaps more meaningful, way of looking at the data is to sort the citations into four categories as shown here.

Categorized Nationwide E-Tag Survey Results, 1/1/18 – 6/31/18
Now, if there was an award to the highest total citation count, it would be the Policy & Procedure category at 1,875 (or 43%). But don’t miss the fact that there are 12 separate E-Tags in this category – that’s a LOT of surveyor attention and a LOT of plans of correction for you to write and defend.
A third, and perhaps a more revealing perspective, is the number of citations issued per E-Tag in the four categories. In that light, it’s all about Testing & Training with 312 citations per tag compared to half that number for the other 3 categories. Add to that a few of the candid remarks surveyors have shared regarding the Testing & Training, and this needs to be an area of focus for everyone.
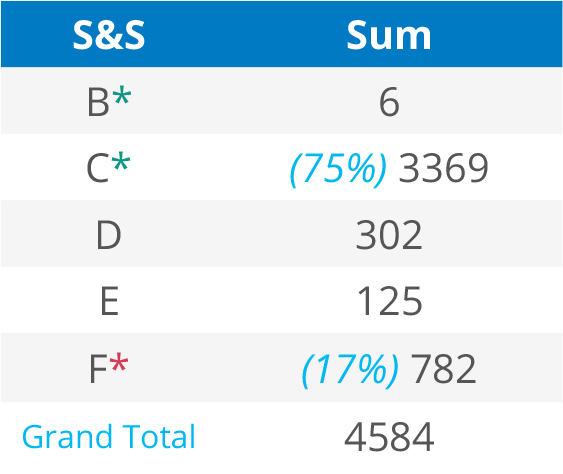
A fourth comparison (and very noteworthy and concerning) has to be Scope & Severity, as shown to the right. Scope refers to how many residents could be affected by an issue whereas Severity relates to the potential harm it could do. (The higher the letter or number, the greater the Severity.)

Scope & Severity

Top 30 States in F-level Citations
Worth emphasizing is the reality that every single citation issued requires a plan of correction. There were zero A-level citations NATIONWIDE. Intuitively, that does not make sense unless it was by a directive, but of course, that supposition provides no real value. The vast majority (3,375) were B’s and C’s or in “substantial compliance.” That said, there was obviously a big number of F-level citations (782 or 17%), which enters the realm of Substandard Quality of Care, or SQC. In short, SQC means a facility is significantly deficient in multiple ways that put residents in danger now or potentially.
As the second chart shows, Oregon, while 12th in total citations, is also first in F-level citations. Several weeks ago, while presenting this data in an Oregon healthcare association conference, I was told secondhand that the state’s surveyors had been instructed not to issue any citations at less than an F level (although I have no way to verify or discredit that). But, when a single state ends up with 137 F-level citations out of a total citation count of only 141 in the state, it causes me to at least question why. It also causes me to back off from drawing any real data-based conclusions. This is particularly so since there was not a SINGLE A-level citation issued out of the 4,584 written. But know this: a couple of surveyors have reportedly stated something to the effect that “We’re going easy with scope and severity this year. Next year, we’ll be issuing I.J.’s.”
So What Does That Mean for You?
We all have to set priorities. And I think it’s rather well recognized that a few vital tasks, on any given day or project, will end up driving the majority of our accomplishments. After you’ve addressed the most pressing concerns for your community’s unique circumstances, move onto the next in line.


